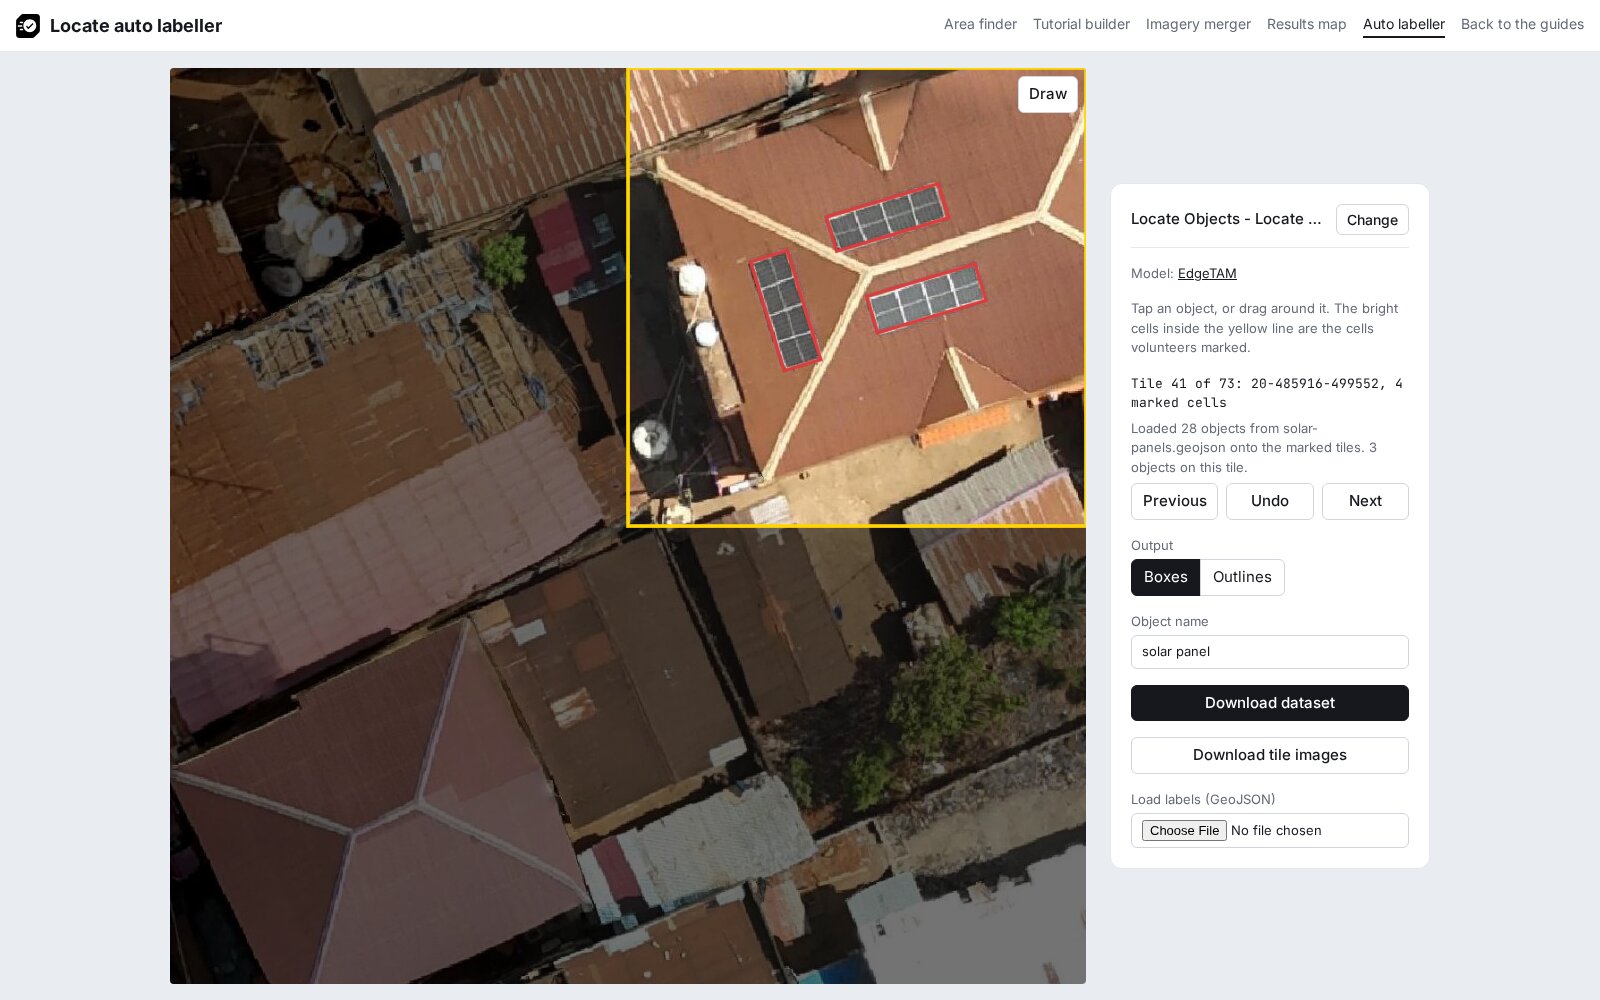
Label in QGIS
The first steps put the project imagery and the cells volunteers marked on the map; the next ones draw a rectangle around each object. The steps follow the QGIS manual on creating layers and editing, and were checked in QGIS 4.2.
1. Add the imagery
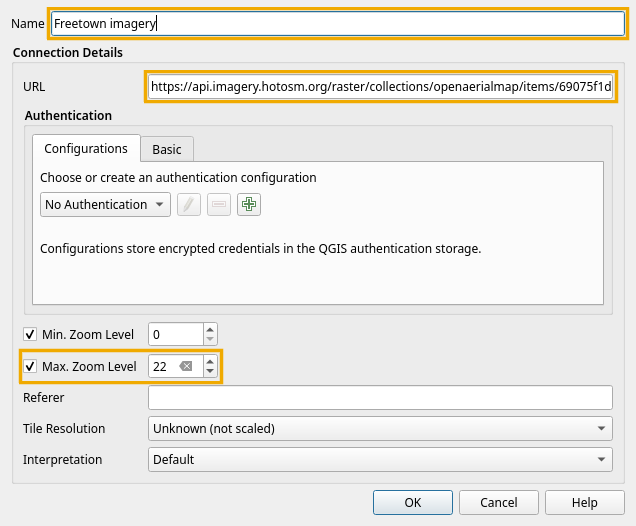
- In the Browser panel, right-click XYZ Tiles and choose New Connection.
- Enter a Name, paste the project's tile URL into URL, tick Max. Zoom Level and set it to 22, and click OK.
- Expand XYZ Tiles and double-click the new connection to add it to the map.
The Freetown example uses this tile URL:
https://api.imagery.hotosm.org/raster/collections/openaerialmap/items/69075f1de47603686de24fe8/tiles/WebMercatorQuad/{z}/{x}/{y}?assets=visual&nodata=0
2. Add the cells
Drag the file saved with Download cells in View the results into QGIS. It is added above the imagery.
3. Colour the cells by answer
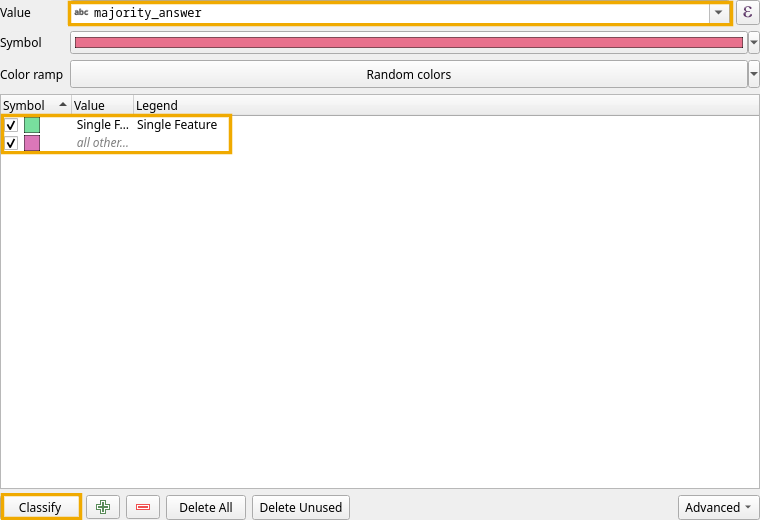
Double-click the cell layer in the Layers panel to open its properties, and open Symbology (QGIS documentation):
- Change Single Symbol at the top to Categorized.
- Set Value to
majority_answer. - Click Classify. QGIS gives each answer in the file, Single Feature and, when the project includes it, Multiple Features, a colour chosen at random. It also adds an all other values class, which stays unused because every cell has one of these answers.
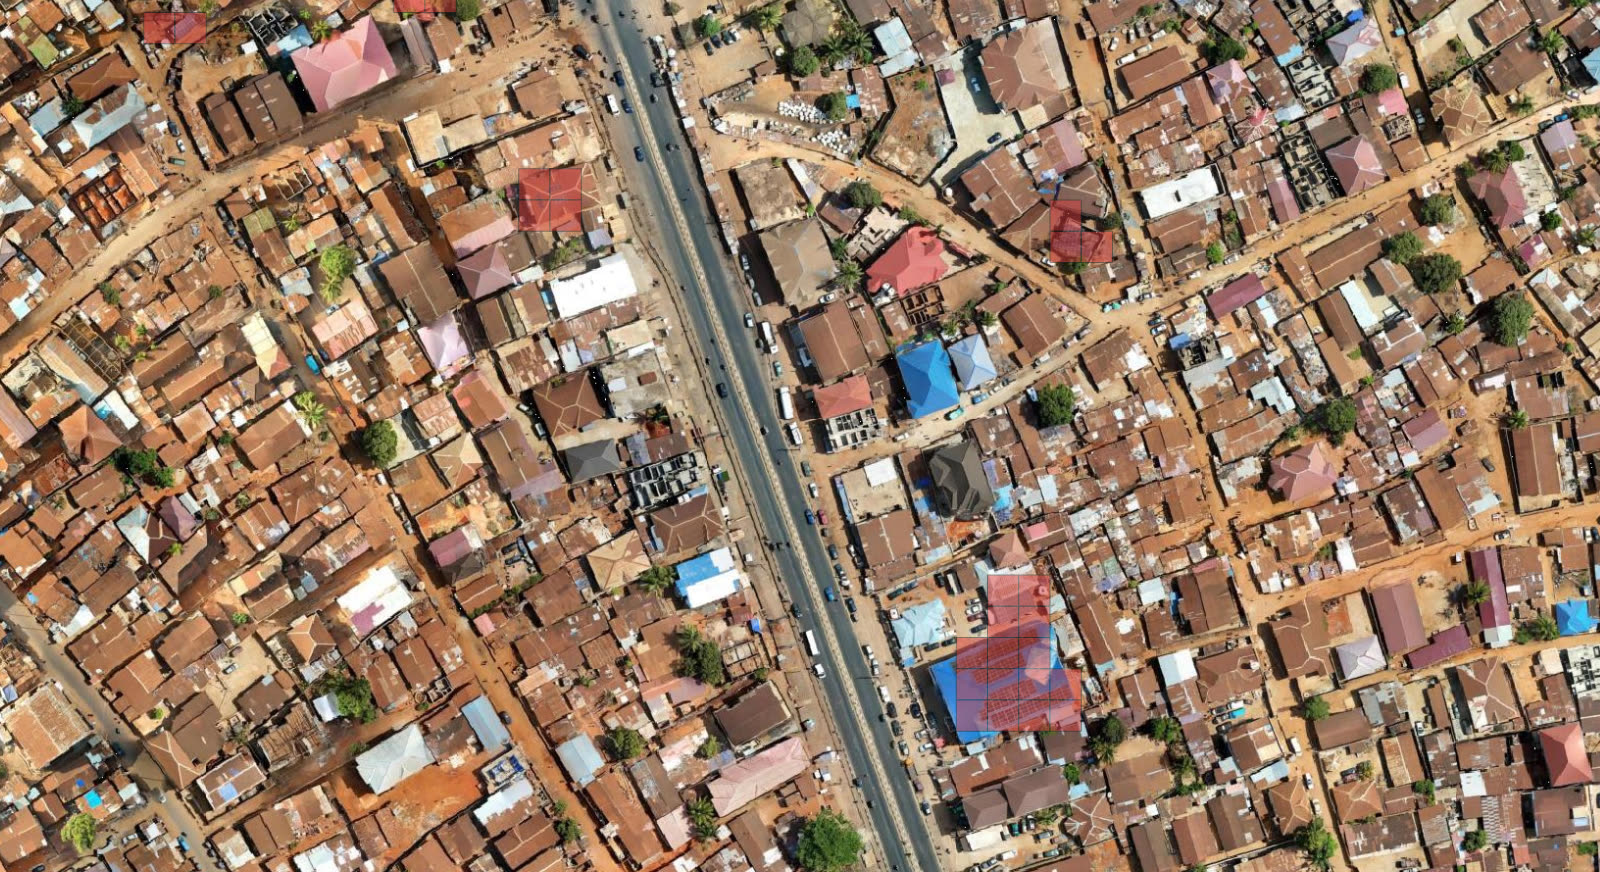
Under Layer Rendering at the bottom of the same tab, set Opacity to 50% so the imagery shows through the cells, and click OK. The colours on your map can differ from the screenshots, since QGIS picks them at random (see step 3).
4. Create a layer
- Open Layer > Create Layer > New Temporary Scratch Layer….
- Enter the Layer name
solar panels, set Geometry type to Polygon and the CRS to EPSG:4326 - WGS 84, and click OK. - If the pencil next to the layer is off, turn it on with Layer > Toggle Editing.
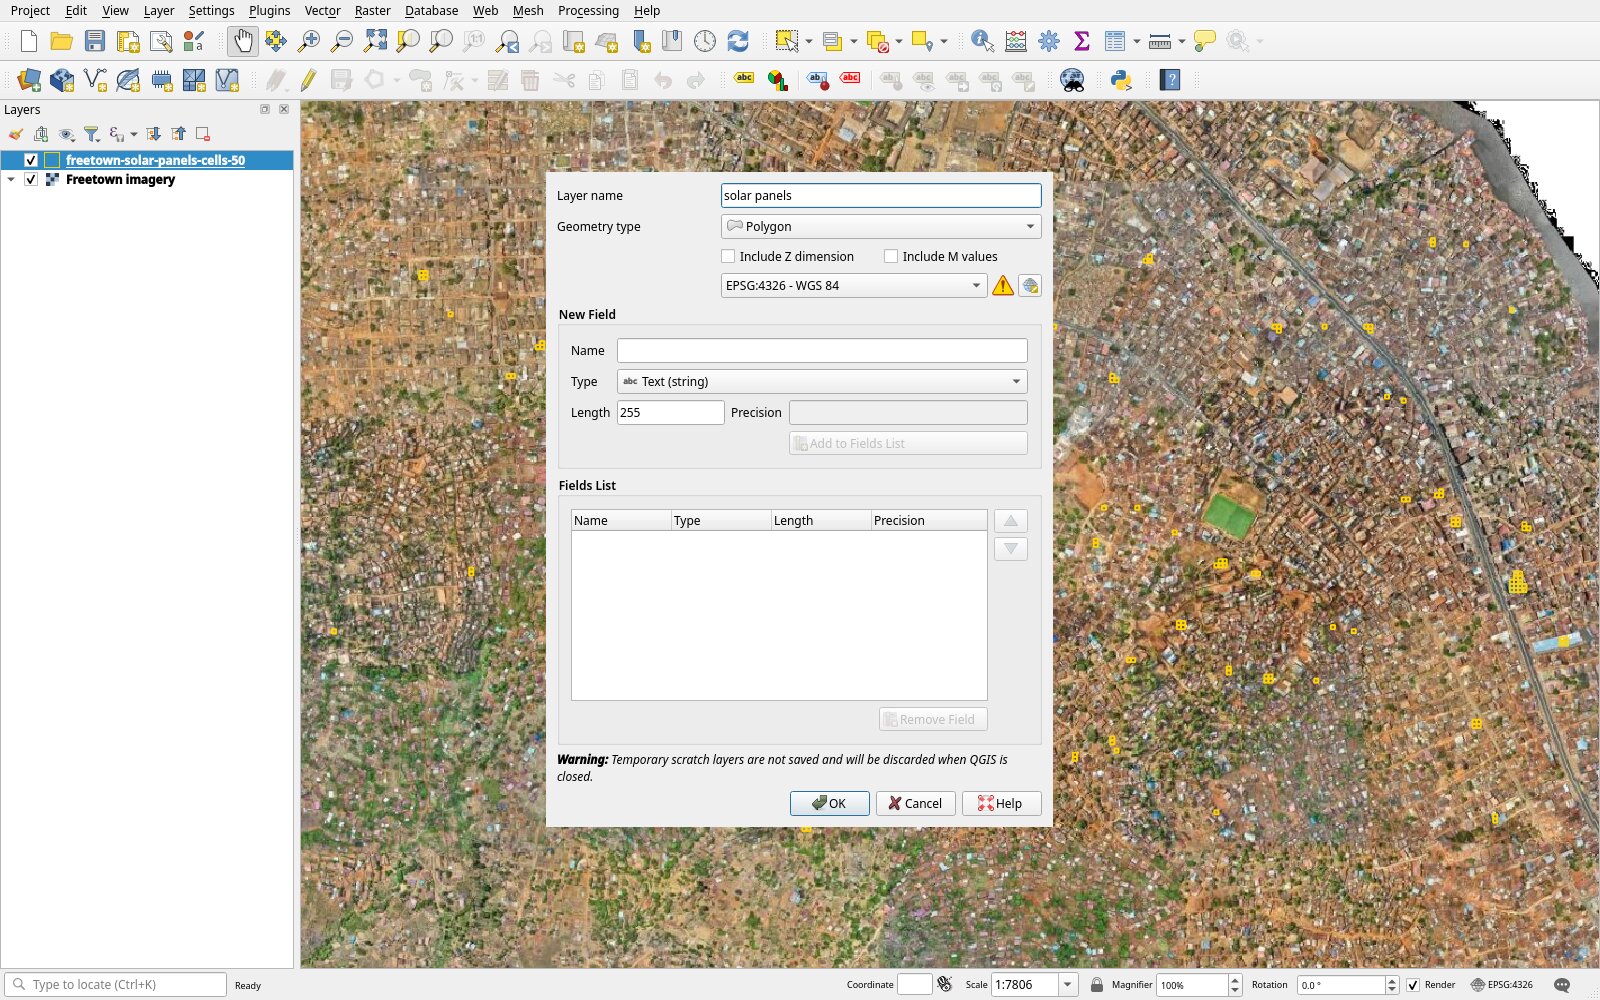
5. Choose the rectangle tool
- Show the shape tools with View > Toolbars > Shape Digitizing Toolbar.
- Click Add Polygon Feature.
- In the digitizing method list, which shows Digitize with Segment at first, choose Digitize Shape.
- In the rectangle list, choose Rectangle from 3 points (projected).
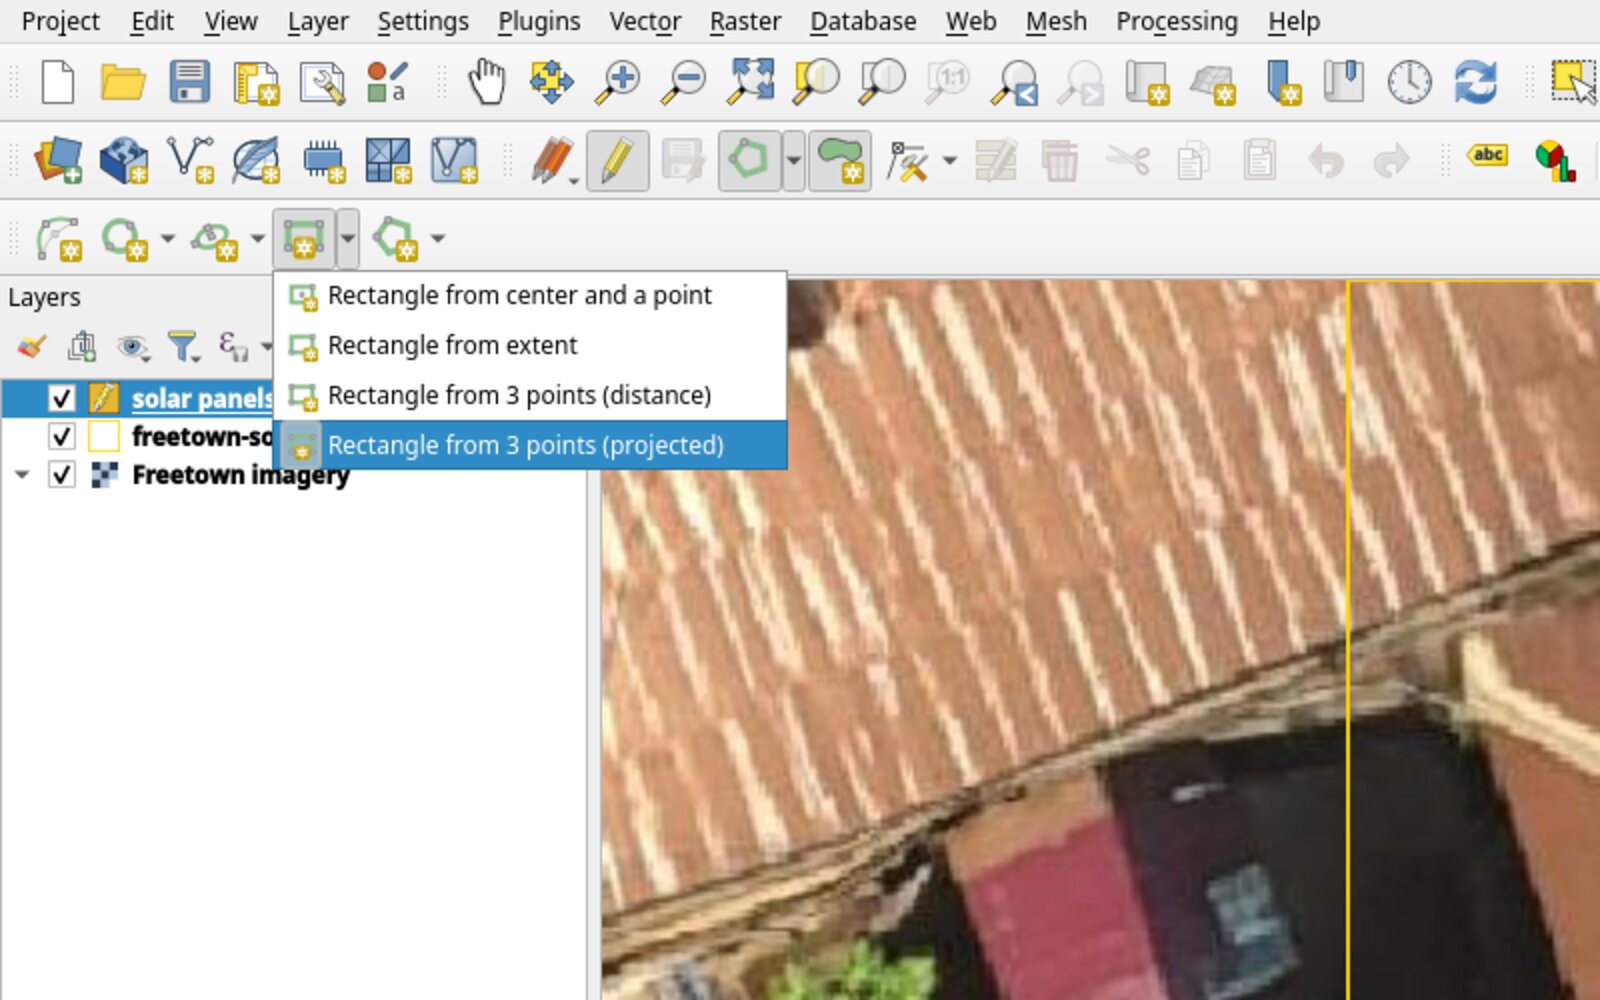
6. Draw a rectangle around each object
For each array of touching panels, left-click two corners along one long edge, then right-click on the opposite edge. The manual describes the tool as drawing an oriented rectangle where "the length of the second edge is computed from the projection of the third point on the first edge."
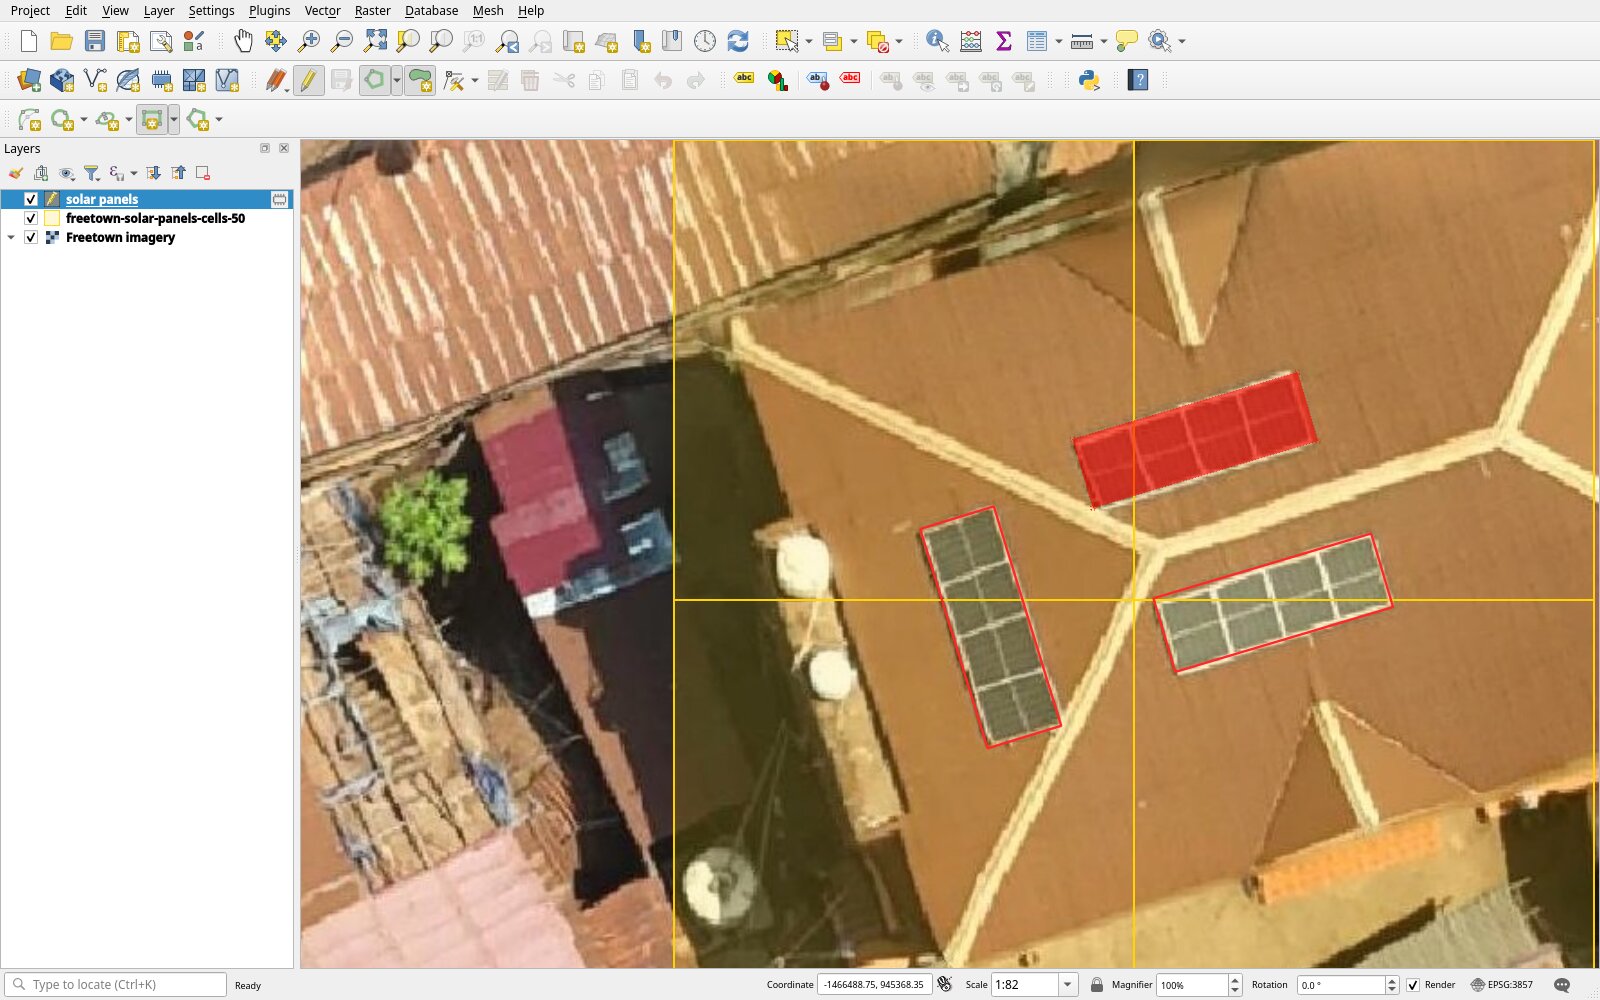
7. Save the layer as GeoJSON
- Click Layer > Save Layer Edits.
- Right-click the layer and choose Make Permanent….
- Set Format to GeoJSON, enter a File name ending in
.geojson, and click OK. The file keeps the layer's CRS, EPSG:4326.
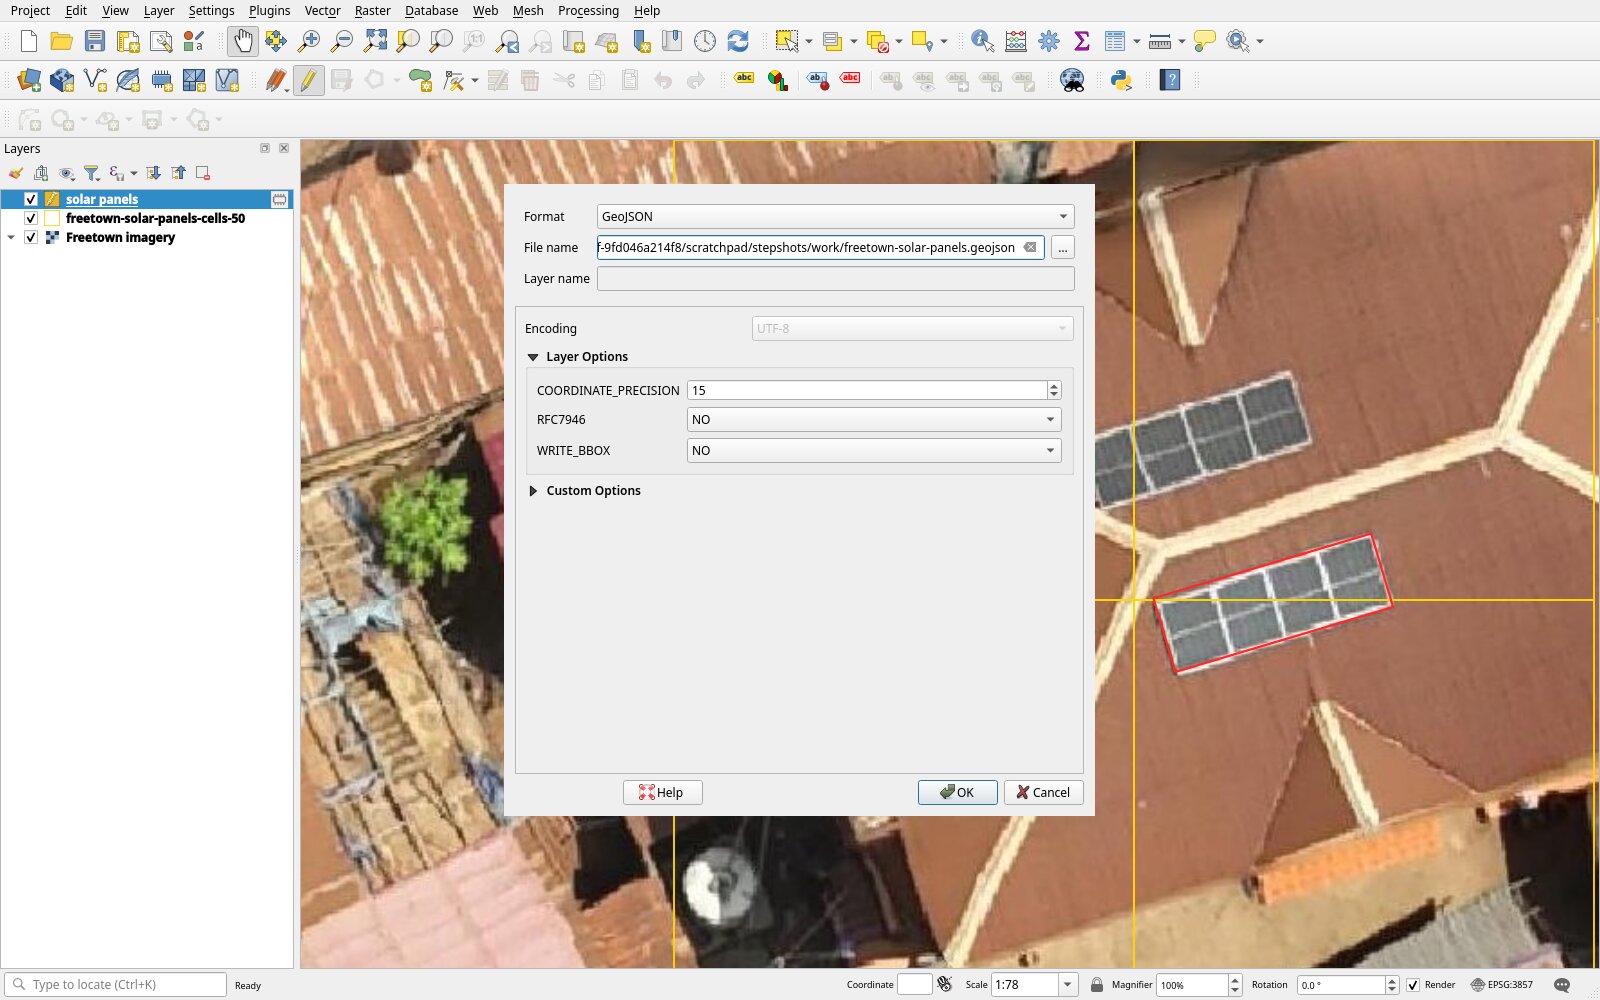
8. Load the file in the auto labeller
- In the auto labeller, load the project.
- Under Load labels (GeoJSON), click the file field (Choose File or Browse…) and pick the file.
- Check each tile with Next, then click Download dataset.
- Check the dataset.