Validation
An AI model makes mistakes: it can mark bare ground as a roof, or call a standing house destroyed. People can check its predictions before they are used. fAIr does this check at scale with MapSwipe, an open app where volunteers answer quick questions about imagery on their phone or on the web.
How it works
- fAIr predicts. A model returns shapes on a map, such as building outlines, or a label for existing shapes, such as the damage to each building.
- The shapes go to MapSwipe. The mapping team creates a MapSwipe project of the type Validate Footprints with those shapes and one question, such as "Does the outline trace the building?"
- Volunteers answer. MapSwipe shows one shape at a time over the imagery, and the volunteer taps Yes, No or Not sure. Each shape is shown to several volunteers.
- The answers decide. In the MapSwipe Results Analyzer, a shape is accepted by default when more than half of its answers are Yes; the share can be changed.
- The results are shared. All answers are published as open data, and the accepted shapes can be downloaded.
Example: building outlines in Freetown
A fAIr model outlined buildings in Freetown, Sierra Leone, on drone imagery from OpenAerialMap. A MapSwipe project asked volunteers to mark an outline as correct if it accurately traces the building.
- 8,565 fAIr outlines, most seen by 3 or 4 volunteers
- 410 volunteers gave 32,831 answers
- 2,456 outlines accepted, 3,260 rejected, and 2,849 with no clear majority
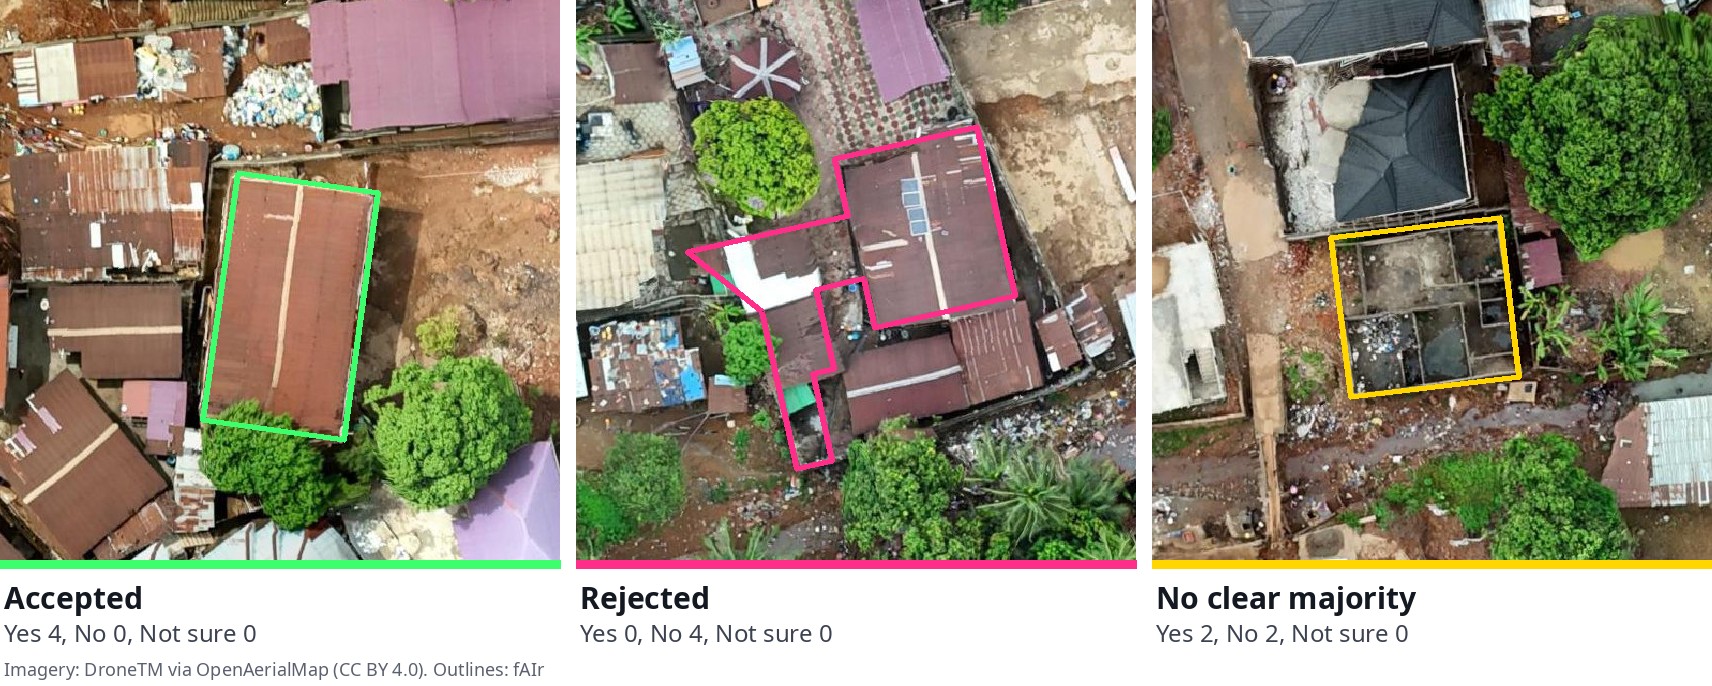
The rejected outlines show what the model still gets wrong, and the accepted ones can be used. To explore the results on a map, open the project in the MapSwipe Results Analyzer: choose the share of Yes answers an outline needs, and download the accepted outlines as GeoJSON. The project itself is on MapSwipe.
Example: damage labels after the Nepal floods
After the August 2026 floods in Nepal, a fAIr model labelled the damage to each building mapped in OpenStreetMap. A MapSwipe project showed 6,096 of these buildings over imagery taken after the flood, and 1,775 volunteers, about 30 per building, answered whether they could see the building. Comparing their answers with fAIr's labels:
| fAIr's label | Buildings | Most volunteers saw it | Most did not see it | No clear majority |
|---|---|---|---|---|
| Destroyed | 183 | 2 | 100 | 81 |
| No visible damage | 4,160 | 2,830 | 429 | 901 |
Buildings labelled major damage, minor damage or no data are not shown.
For 2 of the 183 buildings fAIr called destroyed, most volunteers saw a standing building. The 429 buildings fAIr called undamaged that volunteers could not see are the ones to review by hand. See the results and the project.
MapSwipe has also checked fAIr damage predictions after the earthquakes in Colombia and Venezuela; see Activations.
Limits
- Volunteers only see the shapes they are given. A building the model missed is never shown, so it is not caught here; Evaluation covers how missed features are measured.
- A No marks a shape as wrong but does not redraw it.
- Volunteers see one image. Showing imagery from before and after an event, so they can compare, is in development for Validate Footprints (MapSwipe backend, MapSwipe data model).
Finding training data with MapSwipe
MapSwipe is also used before a model is trained, to find where an object appears. In a Locate Objects project, MapSwipe shows an imagery tile split into a grid of squares, and volunteers tap each square that contains the object.
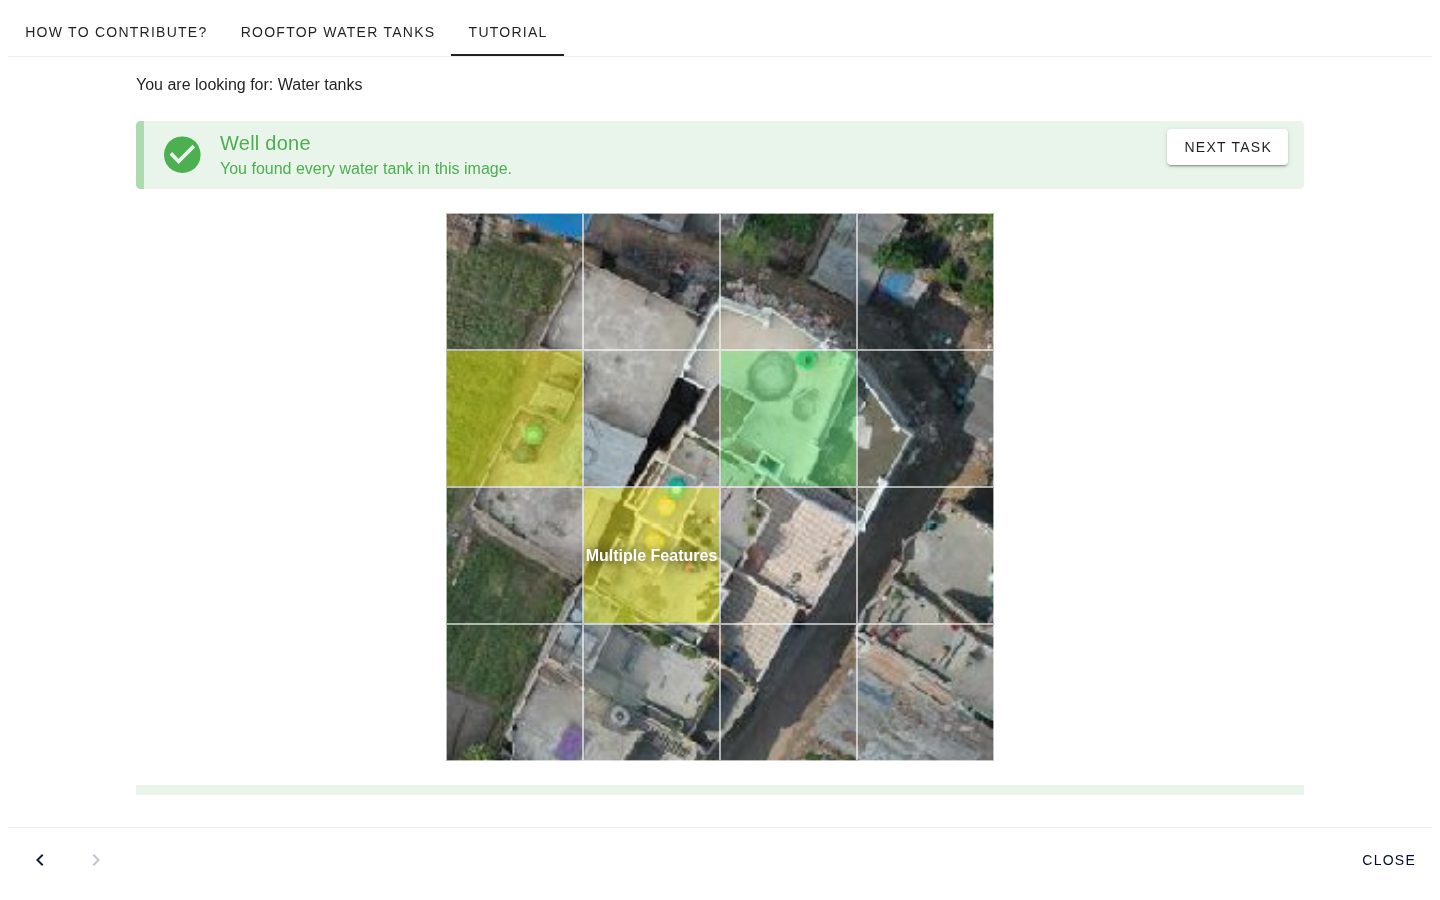
The squares that most volunteers marked show where the objects are. A square shows that an object is there, not its outline, so the squares are a starting point for a training dataset; fAIr does not import them directly.
For example, 221 volunteers looked for rooftop solar panels in Freetown, Sierra Leone (project). The Locate results helper shows the results on a map and downloads the marked squares as GeoJSON.
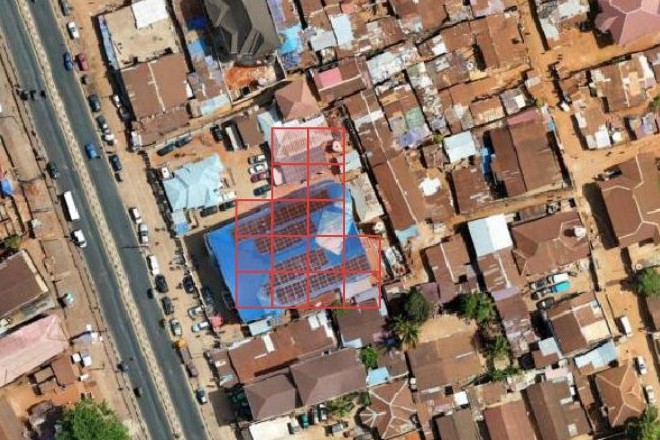
The MapSwipe Locate tutorials explain how to set up such a project, step by step. Community projects that use MapSwipe with fAIr, called fAIrSwipe, are listed on Field projects.